
UNIT 1 : Analyzing categorical data
UNIT 2 : Displaying and comparing quantitative data
UNIT 3 : Summarizing quantitative data
Lesson2 : Variance and standard deviation of a population - Mean, standard deviation vs median, IQR
when you have data points that would skew the mean, median is much more robust
특정 데이터가 평균으로부터 크게 왜곡되어 있으면 'mean'과 'standard deviation'도 데이터를 잘 나타내지 못하게 된다.
이 경우에는 'median'과 'IQR'이 더 적절한 통계이다.
집중경향성(center tendency)과 집중경향성 주위의 분포(spread around that center tendency)

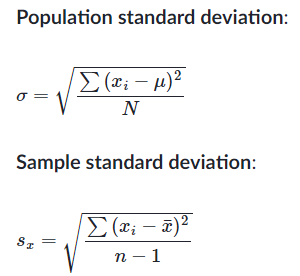
Lesson5 : Variance and standard deviation of a sample
If the data is being considered a population on its own, we divide by the number of data points, n
If the data is a sample from a larger population, we divide by one fewer than the number of data points in the sample, n-1
Lesson 7 : Box and whisker plots - Judging outliers in a dataset
데이터셋에서 이상치를 발견해 그것을 제외하고 상자그림을 그릴 수 있다.
이상치를 찾는 규칙은 '1.5 x IQR' 이다.

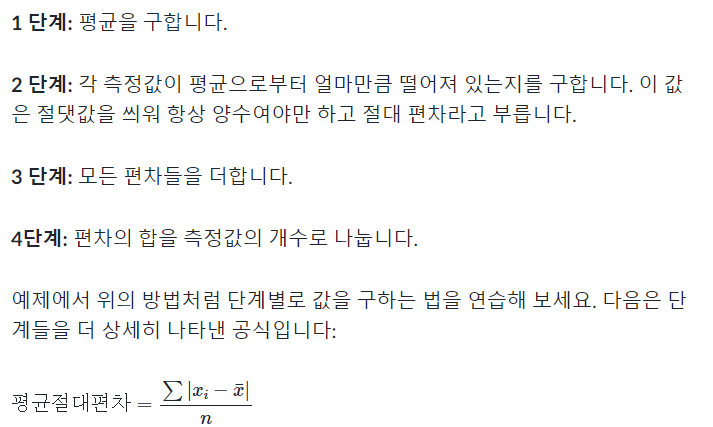
Lesson 8 : Mean absolute deviation (MAD)
UNIT 4 : Modeling Data Distributions
Lesson 3 : Effects of linear transformations - How parameters change as data is shifted and scaled
mean and median follow the change when the data is shifted or scaled.
standarad deviation and IQR also doesn't change when the data is shifted.
But, when the data is scaled, standard deviation and IQR change.
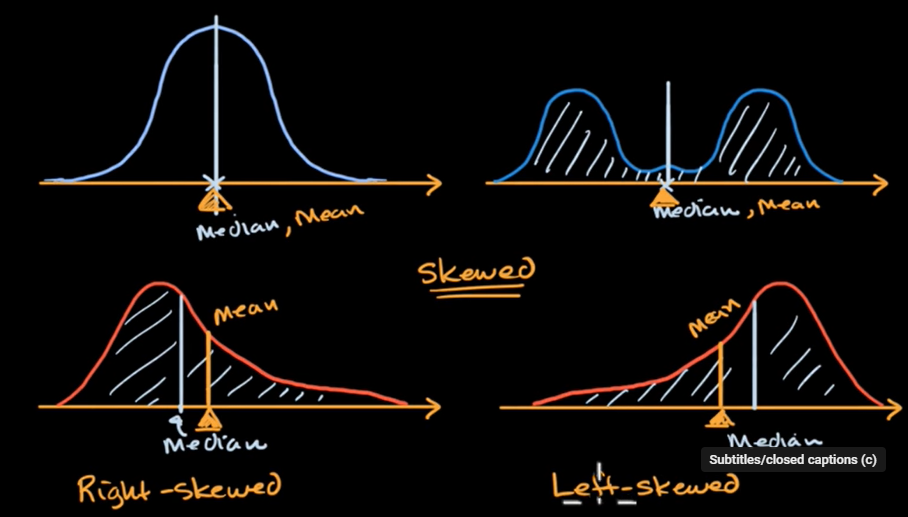
Lesson 4 : Density Curves
막대그래프를 계속 잘게 쪼개면 결국 곡선으로 만들 수 있다. 이것이 density curves 밀도 곡선이다.
left-skewed 이면 mean이 median 보다 왼쪽에 있는 것을 알 수 있다.
Lesson 5 : Normal Distributions and the empircal rule

UNIT 5 : Exploring bivariate numerical data
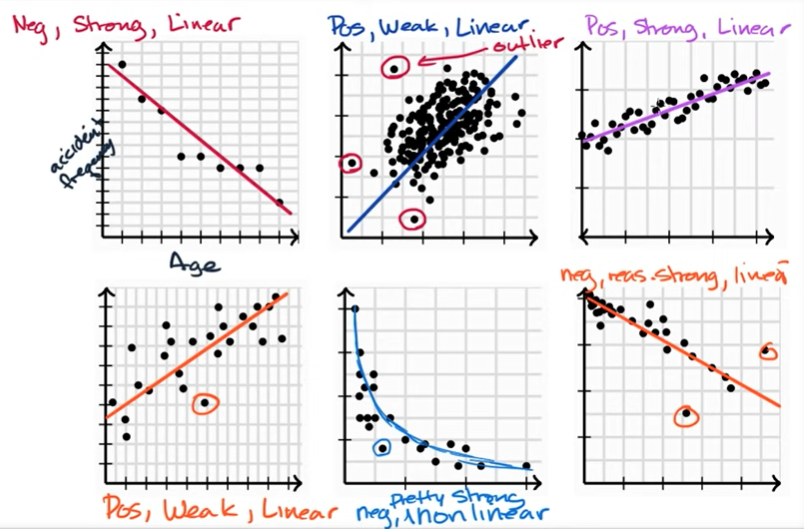
Lesson 1 : Introduction to scatterplots - Bivariate relationship linearity, strength and direction
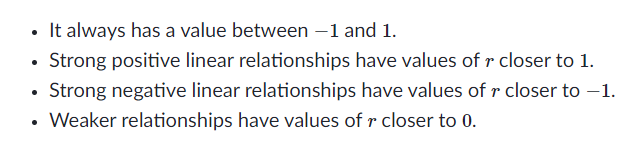
Lesson 2 : correlation coffeicient 'r'

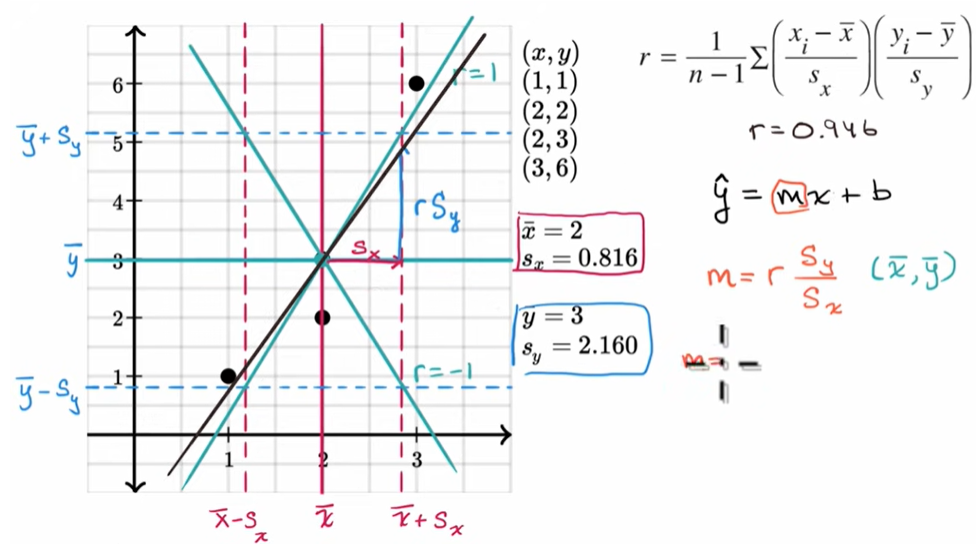
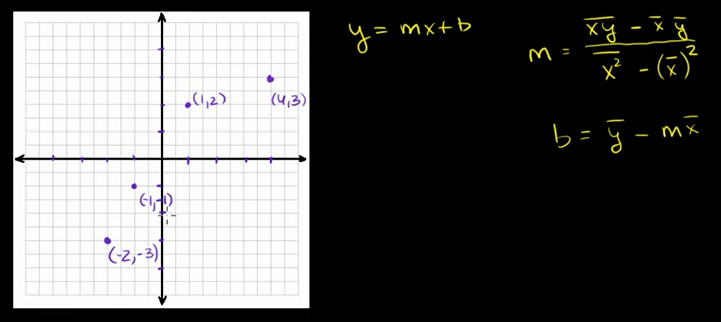
Lesson 4 : Least-squares regression equations (최소제곱회귀 방정식)
A residual (잔차) is a measure of how well a line fits an individual data point.

calculating the equation of a regression line
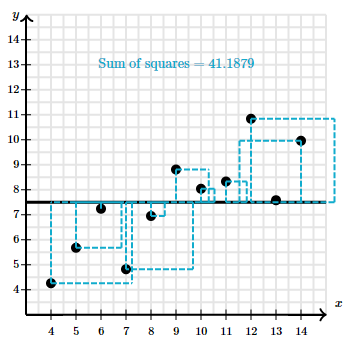
Lesson 5 : Assesing the fit in least-squares regression

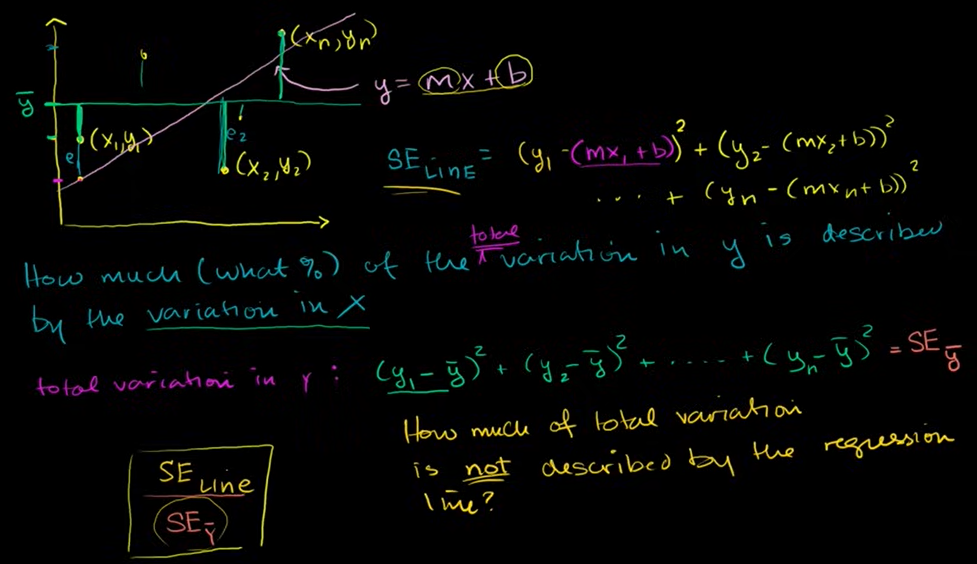
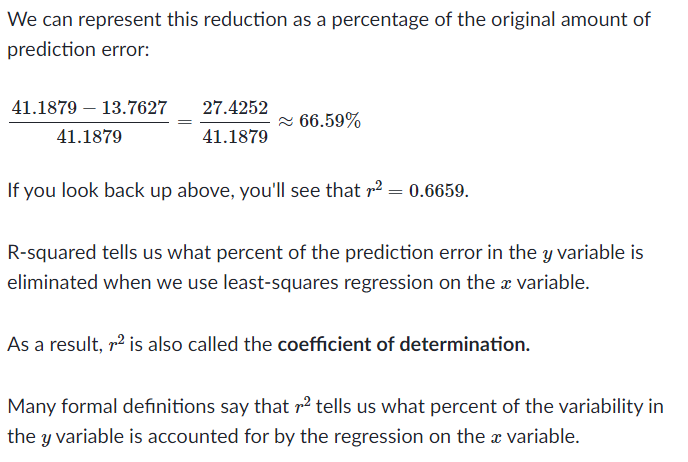
전체 변동값 중 얼만큼의 퍼센트가 직선으로 설명되는지가 나온다. x의 변동값으로 설명된다.
이 수를 결정계수 r^2 (coefficient of determination) 라고 한다.
직선의 제곱오차가 작다면 y 직선에 가까운 것이기 때문에 빼는 값이 적어서 직선이 데이터들에 good fit 하다는 것을 의미한다. r^2 가 1에 가깝게 나오게 된다. y 변동값 중 많은 양이 x의 변동으로 설명된다.
직선의 제곱오차가 크다면 y 직선과 멀리 떨어진 것이기 때문에 점들과 직선 사이의 오차가 크기 때문에 r^2 가 0에 가깝게 나오게 된다. y의 변동값 중 적은 양이 x의 변동 또는 직선으로 설명된다는 뜻이다.
Standard deviation of residuals(잔차의 표준편차) / Root-mean-square error (RMSD) (평균 제곱근 오차)
평균 잔차 측 잔차의 표준편차 값이 작을수록 직선이 데이터들에 fit 하다는 것을 말해준다.

Lesson 6 : More on regression - Squared error of regression line
UNIT 6 : Study Design
Lesson 4 : Types of studies
Sample study : estimate population parameter (모집단의 모수를 예측한다)
Observation study : seeing if there is a correlation between two things (상관관계). be careful not to say one is causing the other cause you could have confounding variable (인과관계 X 혼재변수가 있을 수 있다.)
Experiment study : estable or show causality (인과관계) taking group randomly assigned to a control or treatment. (대조군과 실험군) That should evenly distribute the confounding variables. (혼재변수를 분산) change how much of one of these variables they get and you see if it drives the other variable (특정 변수를 조절해서 그것이 다른 변수를 조절하는지를 본다)
UNIT 7 : Probability
Lesson 4: theoretical and experimental probability
Probability tells us how likely something is to happen in the long run.
We can calculate probability by looking at the outcomes of an experiment or by reasoning about the possible outcomes.
Lesson 9 : Conditional probability and independence
Dependent probability


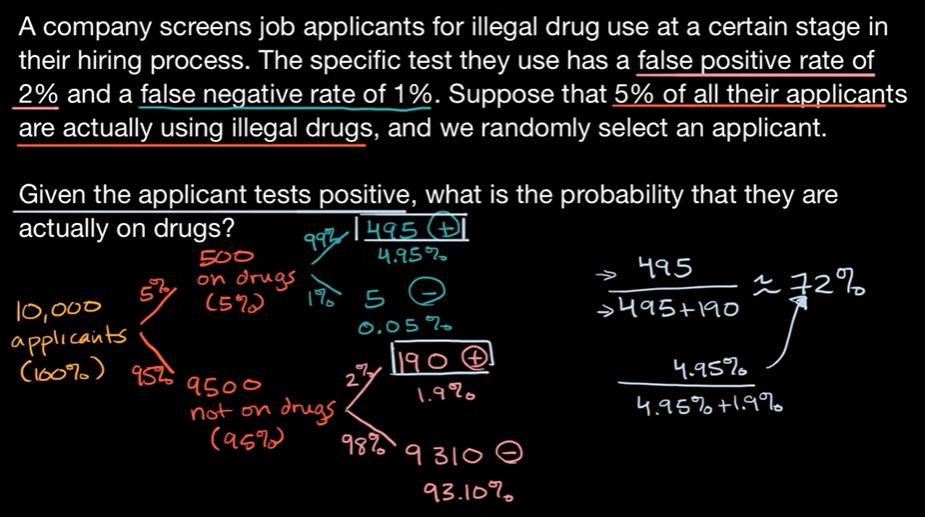
Conditional probability and tree diagram
조건부 확률을 나무 구조도로 그리면 쉽게 이해할 수 있다.
아래 문제에서 보듯, 거짓으로 양성이 도출되는 확률 2%, 거짓으로 음성이 도출되는 확률 1%는 굉장히 작아 보이지만
양성이 나오는 것들 중 제대로 도출하는 조건부확률이 72%밖에 안 되는 것을 계산해 보면, 무려 28%나 오차가 발생함을 알 수 있다.
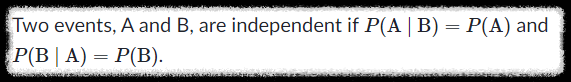
Conditional probability and independence
열차가 지연될 확률 P(delayed) 와 눈 오는 날 열차가 지연될 확률 P(delayed|snowy) 이 동일하다면 둘은 독립적이다.(independent)
눈 오는 날이라고 해서 다른 확률이 나오지 않기 때문에 영향을 주지 않는다고 볼 수 있는 것이다.
둘의 값이 동일하지 않다면 둘은 종속적이다. (dependent)

UNIT 8 Counting, Permutations, and Combinations
Lesson 2 : Permutations


Lesson 3 : Combinations
조합은 순서가 상관이 없다.
순열(permutations)을 계산한 값에서 배치를 하는 경우의 수를 나눈다.


'Mathematics and Statistics' 카테고리의 다른 글
| Probability and Statistics_Khan [Unit 11~16] Statistics (2) | 2024.01.25 |
|---|---|
| Probability and Statistics_Khan [Unit 9~10] Random Variable, Sampling Distribution (1) | 2024.01.22 |
| Review >> Essence of Linear Algebra_3Blue1Brown (1) | 2024.01.14 |
| Essence of Linear Algebra_3Blue1Brown (2) | 2024.01.14 |
| Review >> Linear Algebra_Khan (2) | 2024.01.09 |